In the previous post, we looked at lemma and token coverage in the works of Plato assuming knowledge of Greek New Testament vocabulary. Here we graphically look at those results and make an important observation.
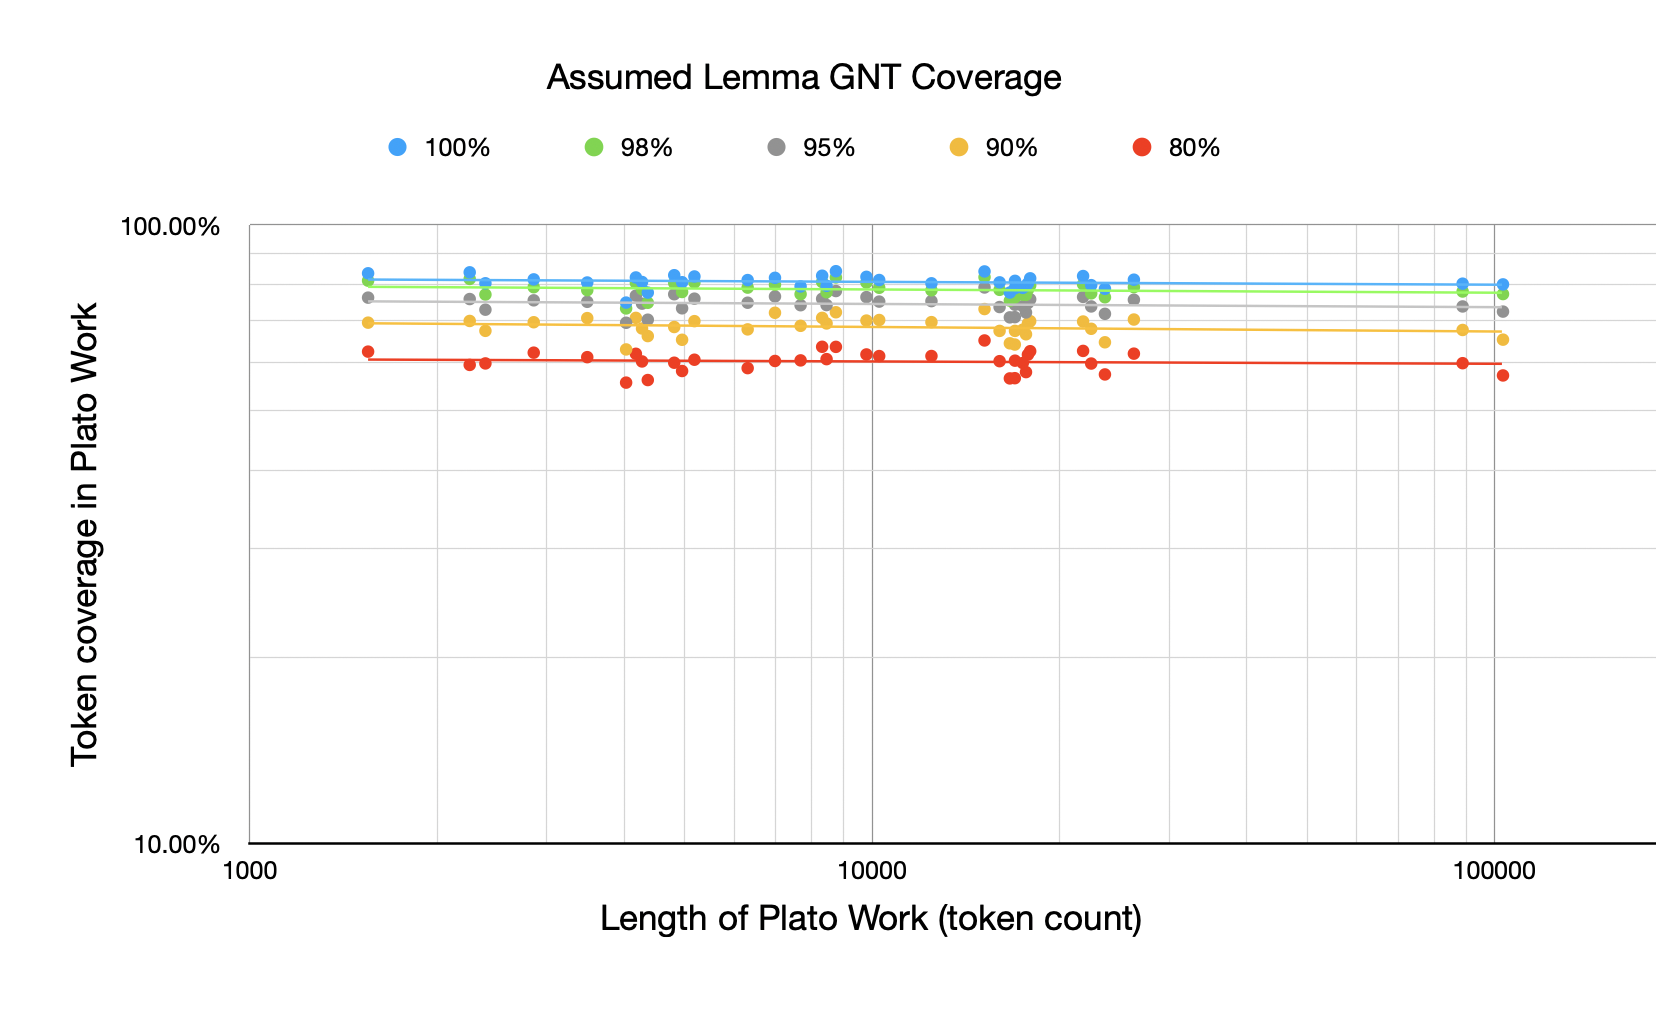
For this first chart, I haven't just shown the GNT 100% and 80% but also the 98%, 95%, and 90% levels. The chart shows, assuming you've learned a certain % of GNT lemmas, how many tokens in the works of Plato are from those lemmas plotted against the length of the Plato work. All the plots here are log-log because of the Zipfian nature of word distributions (although it is more important in subsequent plots than this one).

At mentioned in the previous post, I was actually surprised at how little coverage drops off as a function of the length of the Plato work. A 100,000 token work has very similar token coverage than a 5,000 token work.
Visually this can be seen in how horizontal the best-fit lines are above.
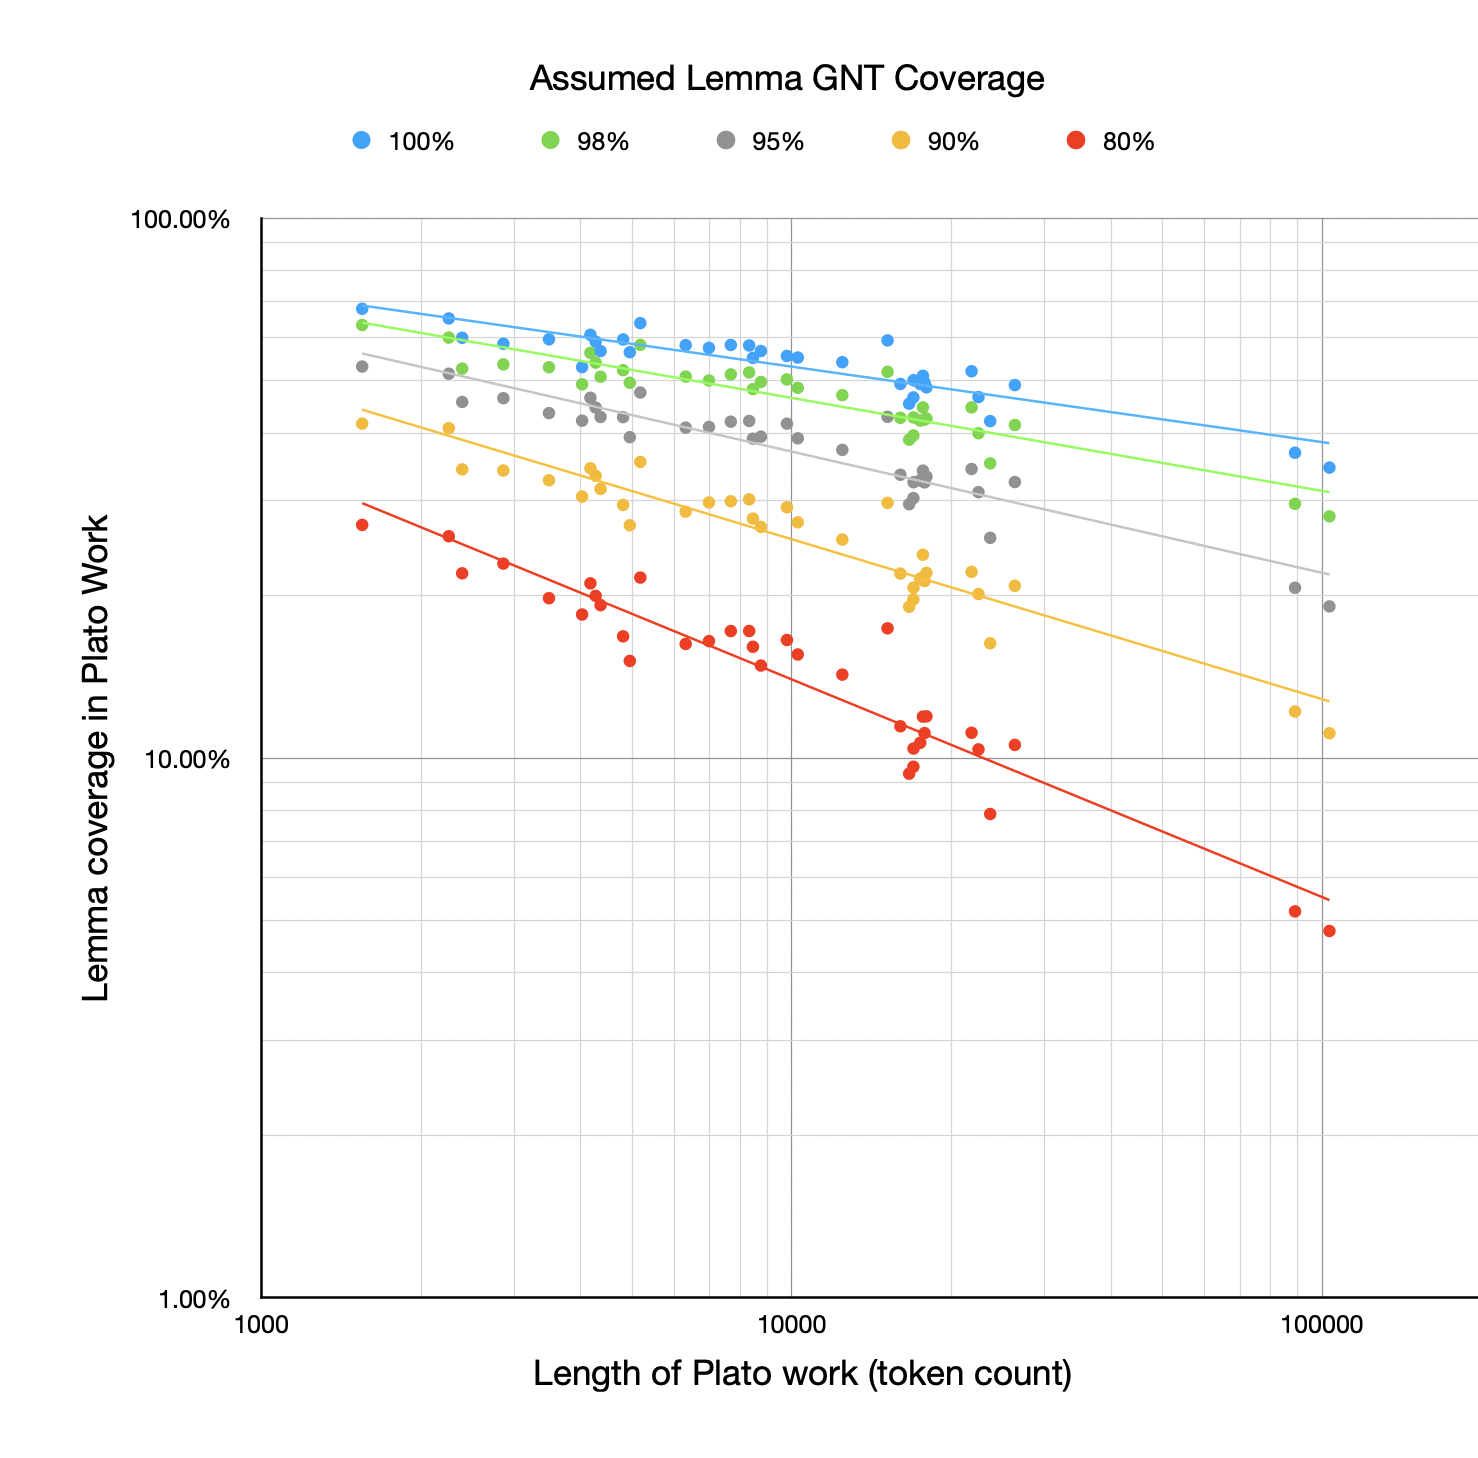
However, when it comes to lemma coverage rather than token coverage, the story is very different:

The drop-off above as the Plato work gets longer is quite dramatic (especially when you consider this is a log-log plot). The points fit quite well to a line, though, indicating how Zipfian the distribution is. This demonstrates the clear relationship between the length of the work and how many lemmas you're likely familiar with. The longer a work is, the more distinct lemmas it will use, although they tend to be low frequency within the work (hence how horiztonal the lines in the first chart are).
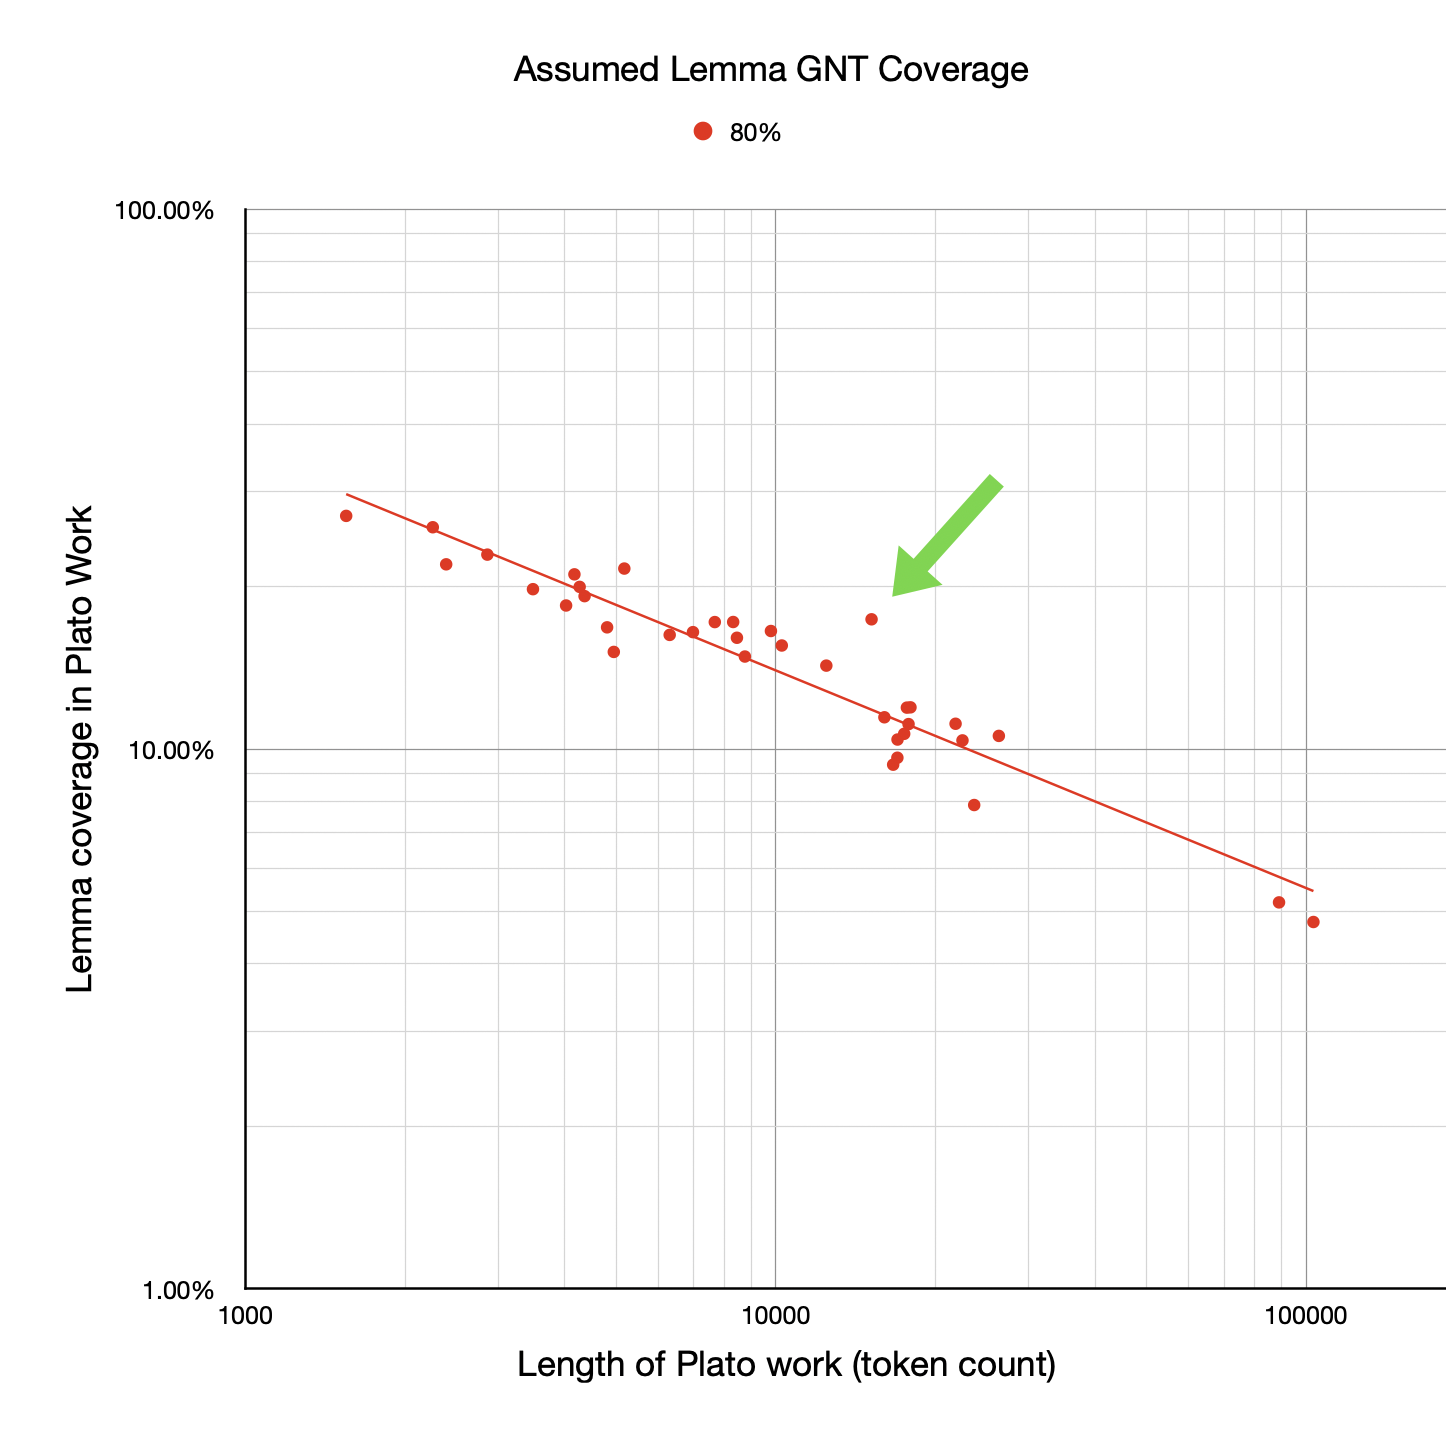
Notice there are some outliers—some works that seem to have higher coverage than their length would suggest given the best-fit line. I've called out one here, showing just the GNT 80% points and best-fit line (although it's an outlier on the others too):

This suggests that this work might be, in some sense, easier for a GNT reader to read compared with other works of Plato. It suggests that perhaps the vocabulary of that particular work is closer to that of the GNT. The data was all there in the previous post but it's a lot easier to spot the outliers graphically.
The work indicated above is Parmenides. I started wonder what it was about that work that made it more "GNT like".
Then I took a step back because I realised there may be a confounding factor here. The statement "this work might be easier for a GNT reader to read compared with other works of Plato" stands but note this might not be a property of any GNT/Parmenides shared vocabulary but rather just the word distribution in Parmenides itself. In other words, Parmenides might just be easier compared with other works of Plato and that might have nothing to do with any vocabulary similarity to the GNT.
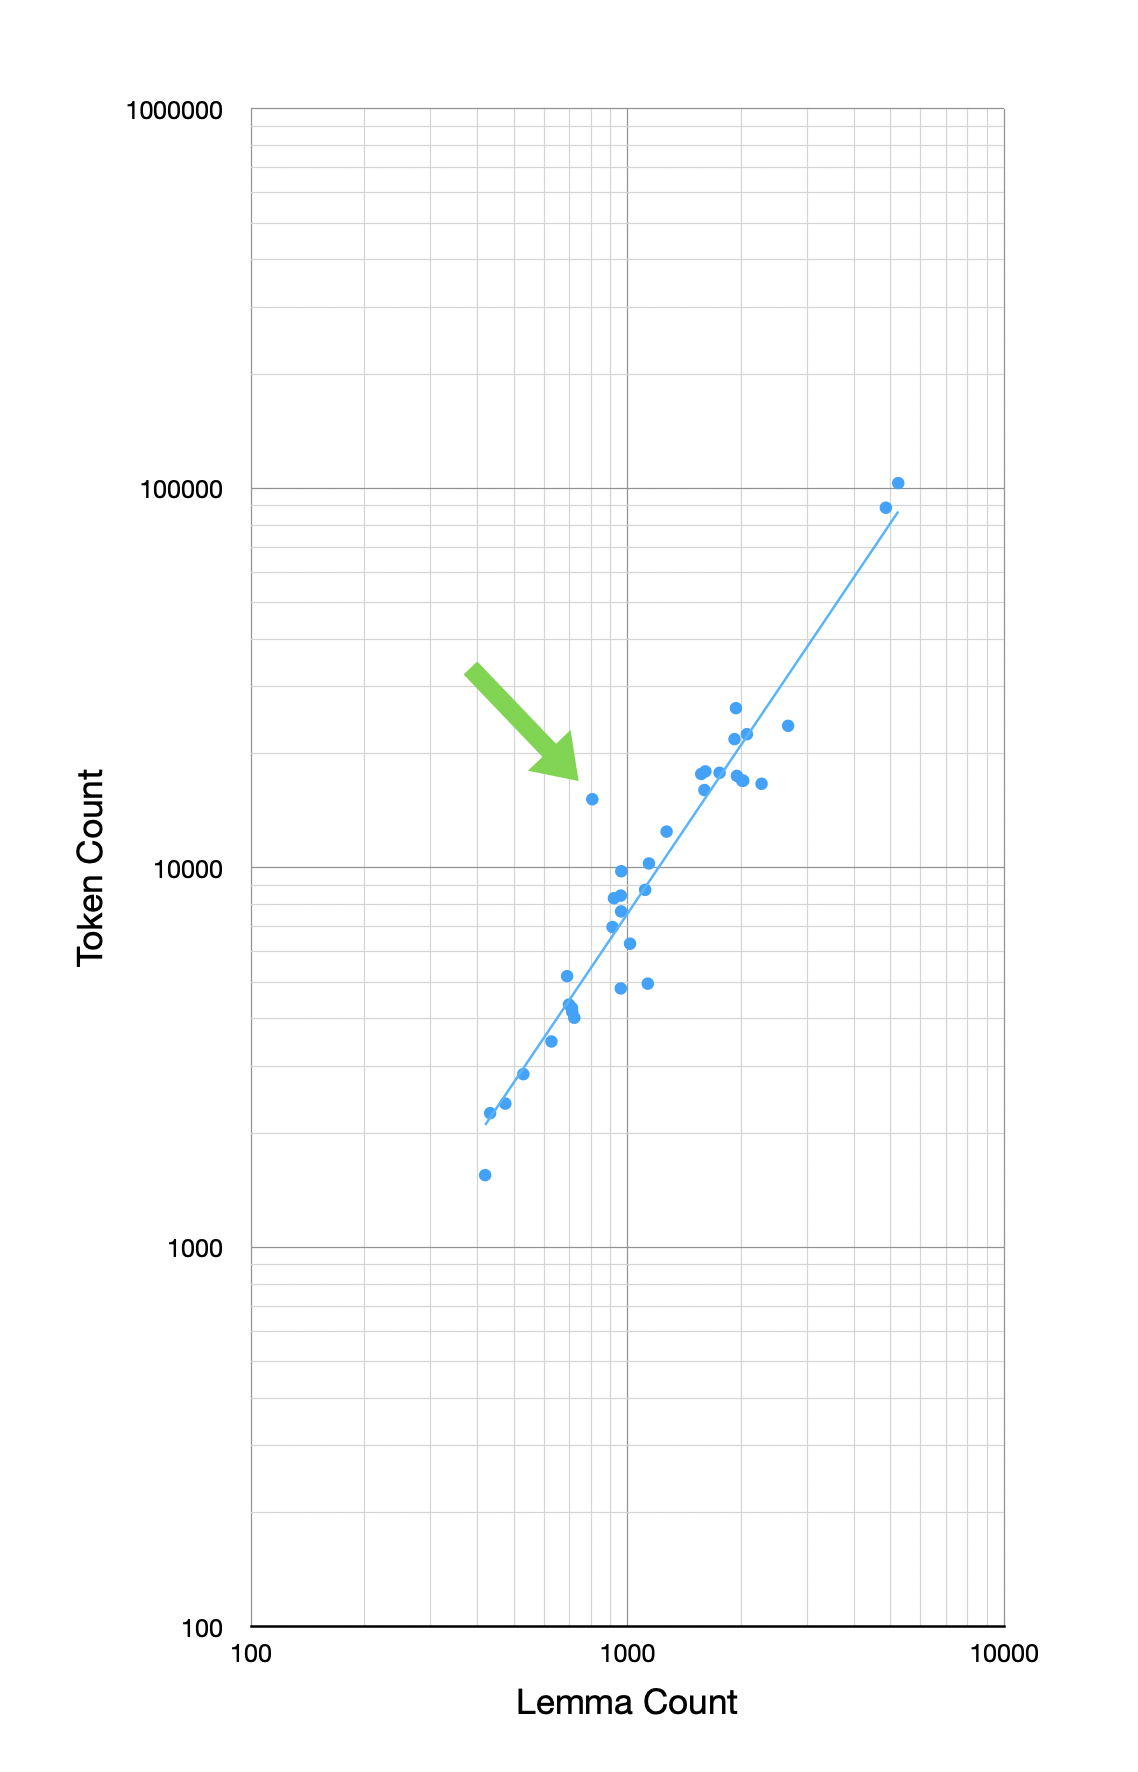
So I decided to just plot the token-to-lemma counts in the works of Plato. This doesn't involve the GNT at all, just how many tokens each work in Plato has versus how many unique lemmas that work has.
Here is the result with Parmenides called out:

In other words, a large part (and maybe all) of why Parmenides stands off the line in the coverage after GNT is because it simply has fewer lemmas for its overall token count. Its vocabulary is just smaller for its length.
In fact, visually you can see that most of the deviations of works from the line in the early charts maps to corresponding deviations in this chart (which remember has nothing to do with the GNT).
This is just some visual comparison. There are more quantative ways of actually measuring how much the deviations in the first three charts can be explained by those in the last chart. But I'll save that for another post.
The important takeaway for now is that, to the extent some works of Plato might be easier to read after the GNT than others, this probably has little to do with any relationship between their vocabularies, and is more to do with the inherent token-to-lemma ratio of the target work of Plato. It is possible to separate out the effects of each, though, and I will explore that in the future.
Note all the caveats I listed in my previous post about this data. Better lemmatization and richer vocabulary models are still needed.